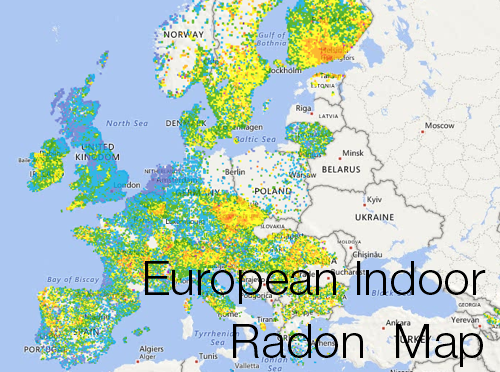
European Indoor Radon Map
The European Indoor Radon Map reports the arithmetic means (AM) over 10 km x 10 km grid cells of annual indoor radon concentration in ground-floor rooms of dwellings.
This grid has been defined by the JRC and uses a GISCO-Lambert azimuthal equal area projection. The input data are provided by national competent authorities (see list below), which aggregate their original data into the grid and calculate a set of statistics per cell: the AM, standard deviation (SD), AM and SD of ln-transformed data, minimum, median and maximum, as well as the number of measurements per cell. Note that this procedure guarantees data protection, since the original data and their exact locations remain at the national level. As new indoor radon data arrive at the JRC from participating countries, the map is updated at irregular intervals.
References
M. Hoffmann, Ch. S. Aliyev, A. A. Feyzullayev, R. J. Baghirli, F. F. Veliyeva, L. Pampuri, C. Valsangiacomo, T. Tollefsen, G. Cinelli, 2017. First map of residential indoor radon measurements in Azerbaijan. Radiation Protection Dosimetry. Vol. 175, No. 2, pp. 186-193. doi: 10.1083/rpd/ncw284.
T. Tollefsen, G. Cinelli, P. Bossew, V. Gruber, M. De Cort, 2014. From the European indoor radon map towards an atlas of natural radiation. Radiation Protection Dosimetry 162 (1-2) 129-134 (2014).
G. Dubois, P. Bossew, T. Tollefsen, M. De Cort, 2010. First steps towards a European Atlas of natural radiation: Status of the European indoor radon map. J. Environ. Radioact., 101, 786–798 (2010).


