Air quality in Europe - 2017 report
The Air quality in Europe report series from the EEA presents regular assessments of Europe's air pollutant emissions, concentrations and their associated impacts on health and the environment.
Based upon the latest official data available from countries, this updated 2017 report presents new information, including:
- updated assessments of total population and ecosystems exposure data, and air quality impacts on health (for the year 2014);
- a sensitivity analysis of the health impact assessments, considering two different counterfactual concentrations for particulate matter (PM) with a diameter of 2.5 μm or less (PM2.5) and nitrogen dioxide (NO2).
- a summary of emissions from agriculture and how they impact on air quality and climate change, which in turn impact on agricultural yields. Selected examples of measures that may mitigate emissions of air pollutants and greenhouse gases are provided.
This report has been written by the European Environment Agency (EEA) and its European Topic Centre on Air Pollution and Climate Change Mitigation (ETC/ACM).
Air pollution is a key environmental and social issue and, at the same time, it is a complex problem posing multiple challenges in terms of management and mitigation of harmful pollutants. Air pollutants are emitted from anthropogenic and natural sources; they may be either emitted directly (primary pollutants) or formed in the atmosphere (as secondary pollutants).
They have a number of impacts on health, ecosystems, the built environment and the climate; they may be transported or formed over long distances; and they may affect large areas. Effective action to reduce the impacts of air pollution requires a good understanding of its causes, how pollutants are transported and transformed in the atmosphere, and how they affect humans, ecosystems, the climate, and subsequently society and the economy.
Concentrations of PM continued to exceed the EU limit values in large parts of Europe in 2015. For PM with a diameter of 10 μm or less (PM10), concentrations above the EU daily limit value were registered at 19 % of the reporting stations in 20 of the 28 EU Member States (EU-28) and in five other reporting countries; for PM with a diameter of 2.5 μm or less (PM2.5), concentrations above the limit value were registered at 6 % of the reporting stations in three Member States and three other reporting countries.
A total of 19 % of the EU-28 urban population was exposed to PM10 levels above the daily limit value and approximately 53 % was exposed to concentrations exceeding the stricter WHO AQG value for PM10 in 2015. This represents an increase compared with 2014, but the magnitude of the change may be considered as being within the expected year‑to‑year variability. Regarding PM2.5, 7 % of the urban population in the EU-28 was exposed to levels above the EU limit value, and approximately 82 % was exposed to concentrations exceeding the stricter WHO AQG value for PM2.5 in 2015 (Table ES.1). This represents a decrease compared with 2014 but is within the expected year-to-year variability.
The year 2015 was a historically warm year globally. On average, over Europe, 2015 was the warmest year on record to that point, with a series of heatwaves affecting Europe from May to September that contributed to several intense tropospheric ozone (O3) episodes.
In 2015, 18 of the EU-28 and four other European countries registered concentrations above the EU O3 target value for the protection of human health.
The percentage of stations measuring concentrations above this target value was 41 %, higher than the 11 % recorded in 2014, and the highest over the previous 5 years. The WHO AQG value for O3 was exceeded in 96 % of all the reporting stations.
Some 30 % of the EU-28 urban population lived in areas in which the EU O3 target value threshold for protecting human health was exceeded in 2015. The proportion of the EU urban population exposed to O3 levels exceeding the WHO AQG was significantly higher, comprising 95 % of the total urban population in 2015 (Table ES.1).
Table ES.1 Percentage of the urban population in the EU-28 exposed to air pollutant concentrations above certain EU and WHO reference concentrations (minimum and maximum observed between 2013 and 2015)
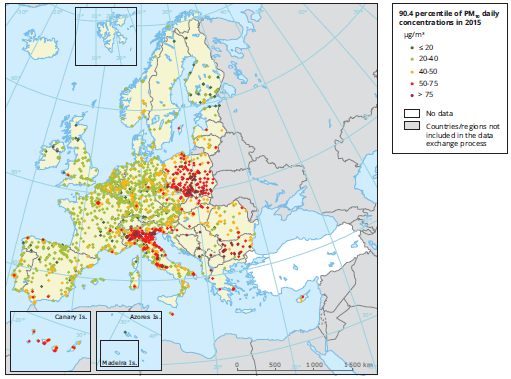
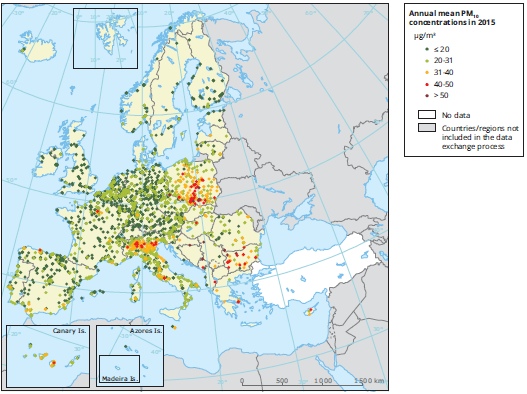
PM10 concentrations continued to be above the EU limit value in large parts of Europe in 2015. Map 4.1 shows concentrations of PM10 in relation to the daily limit value. There were 19 % of stations with concentrations above this daily limit value for PM10 in 20 Member States (see Figure 4.1) and five other reporting countries (12). 95 % of those stations were either urban (78 %) or suburban (17 %). Some of these high daily mean PM10 levels were observed during high PM10 pollution episodes in winter and autumn 2015, as explained in Box 4.1.
Map 4.1 Concentrations of PM10, 2015 — daily limit value
Map 4.2 Concentrations of PM10, 2015 — annual limit value
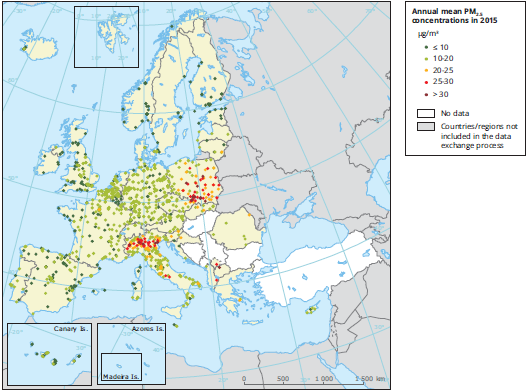
Map 4.3 Concentrations of PM2.5, 2015
Fonte
EEA 2017
Collegati


